
The question
Laplace Immo, a national network of estate agencies, wanted a proof of concept: a relational database of property sales that its teams could query to understand the market. The scope was the first half of 2020, a period that happens to include the first COVID-19 lockdown, from 17 March to 11 May.
My job was to design and build the database, then answer twelve business questions in SQL: how many apartments sold, where, at what price per square metre, and how the market reacted to the crisis.
- 34,169property sales, January to June 2020
- 4tables in a normalised schema
- 12business questions answered in SQL
- +3.7%sales from Q1 to Q2, despite lockdown
Building the database
Three public sources fed the database: the DVF files (Demandes de Valeurs Foncières), the official record of property sales with each property’s type, surface, rooms, price and location; INSEE census data for the population of each commune; and the data.gouv geographic reference for the codes and names of regions, departments and communes.
Before building anything, I wrote a data dictionary listing every field with its type, length, nature and management rules, so that anyone could take the project over. I then designed a normalised schema of four tables linked by foreign keys, which avoids duplicating a commune’s information on every sale.
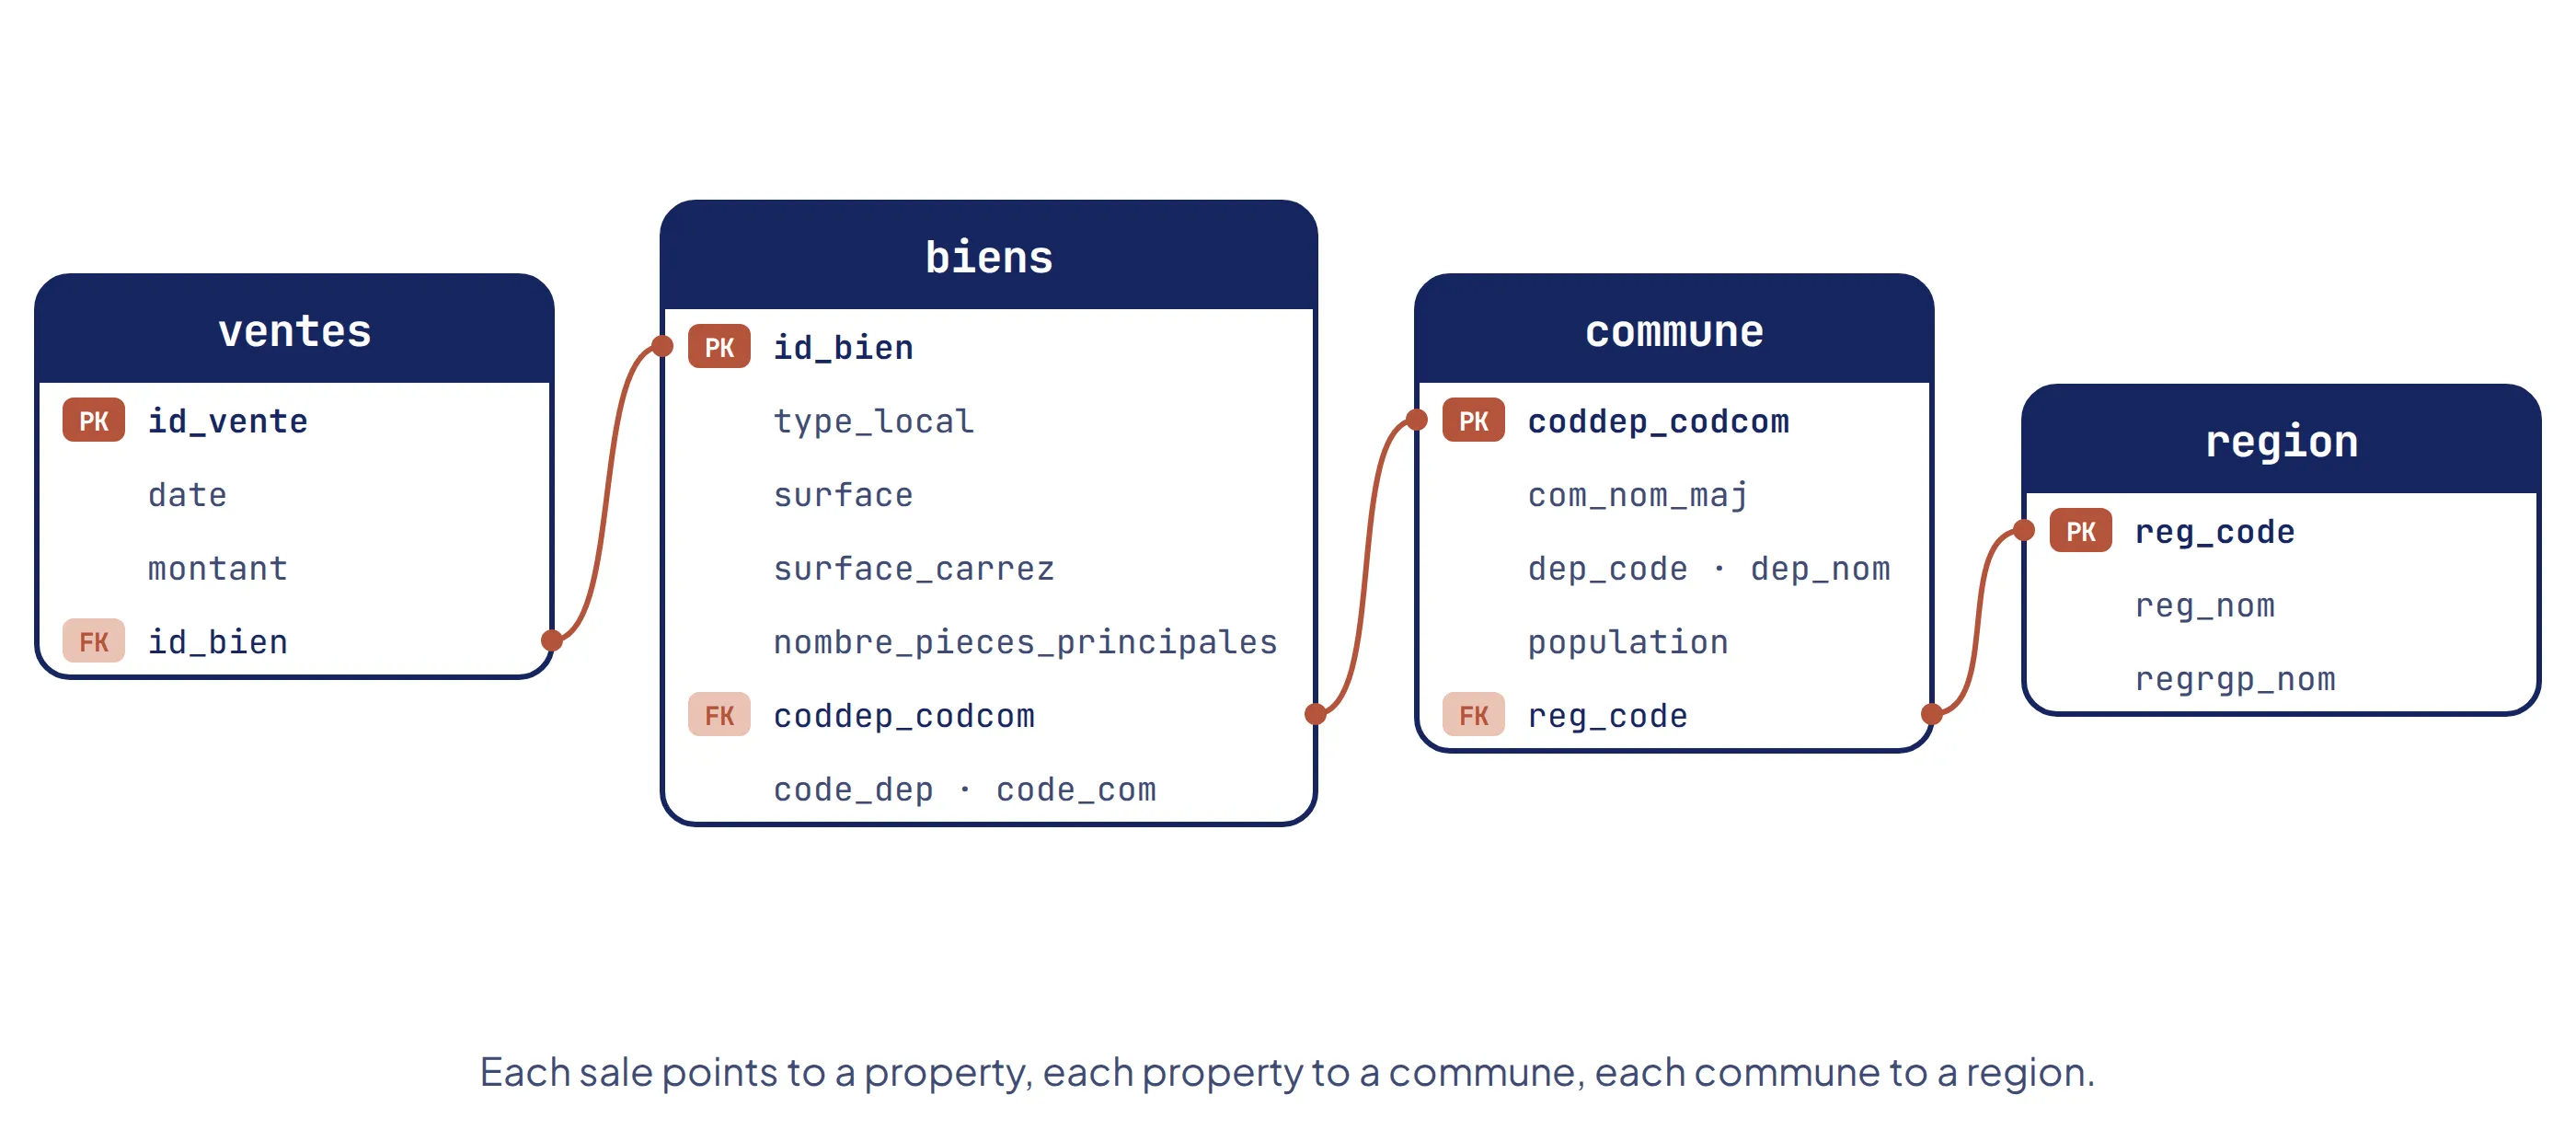
On the GDPR side, the data is public and official, and only the fields needed for the analysis were kept. For the public version of the database, I also removed the street addresses: combined with a price and a date, an address can point to a person. I also prepared, from the design stage, a ready-to-use query for the right to erasure (article 17). By design, it does not rely on cascading deletes: rows are removed explicitly, in the right order, so nothing disappears by accident.
-- Right to erasure: delete one sale, then its property only if nothing else refers to it
DELETE FROM ventes WHERE id_vente = 'v001';

DELETE FROM biens
WHERE id_bien = 'b001'
  AND NOT EXISTS (SELECT 1 FROM ventes WHERE ventes.id_bien = 'b001');
What a second look at the data revealed
When I came back to this project for my portfolio, I audited the data types in the database, and found three silent problems. Dates were stored as text with slashes (2020/01/02), so a standard filter like BETWEEN '2020-01-01' AND '2020-06-30' returns nothing. Most Carrez surfaces, and 237 sale amounts, were stored as text with a decimal comma: SQLite reads '48,22' as 48 in a calculation, and sorts text values above numbers. That last point is why the “most expensive apartments” query only gives the right answer with an explicit CAST.
I fixed all three with one migration script, run once before any analysis, and re-ran the twelve queries. The figures below come from the corrected database: most results move by 1 to 2% at most, and every conclusion holds.
UPDATE ventes SET date = replace(date, '/', '-');

UPDATE biens
SET surface_carrez = CAST(replace(surface_carrez, ',', '.') AS REAL)
WHERE typeof(surface_carrez) = 'text';
Where the apartments sold
31,378 apartments were sold in the first half of 2020, and Île-de-France alone accounts for 45% of them, almost four times more than the next region.
- Île-de-France13,995
- Provence-Alpes-Côte d’Azur3,649
- Auvergne-Rhône-Alpes3,253
- Nouvelle-Aquitaine1,932
- Occitanie1,640
- Pays de la Loire1,357
The market is driven by small and medium apartments: two-room apartments lead with 31.2% of sales, ahead of three rooms (28.6%) and one room (21.5%). Together, one to three rooms make up 81% of sales, a demand shaped by first-time buyers and rental investment.
- 1 room21.5%
- 2 rooms31.2%
- 3 rooms28.6%
- 4 rooms14.2%
- 5 rooms3.6%
Prices: a map of inequalities
- Paris12,049 €
- Hauts-de-Seine7,219 €
- Val-de-Marne5,339 €
- Alpes-Maritimes4,698 €
- Haute-Savoie4,667 €
- Seine-Saint-Denis4,337 €
- Yvelines4,223 €
- Rhône4,059 €
- Corse-du-Sud4,015 €
- Gironde3,764 €
Average of the price per m² of each sale, based on the Carrez surface.
Paris stands at over €12,000 per m², about three times the price in the Rhône or Corse-du-Sud, and the top three are all in Île-de-France. Across all departments, the average price per m² ranges from about €1,000 to €12,000. The gap holds for larger homes too: an apartment of five rooms or more costs €8,750 per m² in Île-de-France, four times more than in Hauts-de-France. A house in Île-de-France, at about €4,000 per m², remains far more affordable than a Paris apartment.
Size also matters: a three-room apartment costs 12% less per m² than a two-room one. Small surfaces command a premium, because demand for them is so strong in high-pressure areas.
Averages of prices per m² are sensitive to extreme values, and DVF contains some: the most expensive “apartment” of the semester is listed at 9.1 m² for €9 million, most likely a whole building recorded against a single unit. So I checked the price rankings against the median: the top four departments are identical, and three rooms still cost less per m² than two: 14% less with medians, against 12% with averages.
The market and the lockdown
WITH quarters AS (
    SELECT
        COUNT(CASE WHEN date BETWEEN '2020-01-01' AND '2020-03-31' THEN 1 END) AS sales_q1,
        COUNT(CASE WHEN date BETWEEN '2020-04-01' AND '2020-06-30' THEN 1 END) AS sales_q2
    FROM ventes
)
SELECT sales_q1, sales_q2,
       ROUND((sales_q2 - sales_q1) * 100.0 / sales_q1, 2) AS growth_pct
FROM quarters;
Sales went from 16,776 in the first quarter to 17,393 in the second: +3.7%, while the lockdown covered half of the second quarter. No collapse, then, but this needs one important nuance: DVF records the date of the notarial deed, which is usually signed two to three months after the buyer and seller agree. Many second-quarter deeds therefore reflect agreements made before the lockdown, completed once notaries could work again. The figures show that the pipeline of sales held; they cannot yet measure the lockdown’s effect on new agreements, which would only appear in the following quarters.
Local dynamics
At commune level, 48 communes recorded at least 50 sales in the first quarter, led by the 17th, 15th and 18th arrondissements of Paris; seven of the top ten are Paris arrondissements, alongside Nice, Bordeaux and Nantes.
Raw volume favours big cities, so I also related sales to population. Among communes of more than 10,000 inhabitants, the most active market per head is the 2nd arrondissement of Paris, with 5.84 sales per 1,000 inhabitants. Three poles account for 17 of the top 20: central Paris (8 communes), the Mediterranean coast (5) and the Atlantic coast (4), two logics that combine dense urban investment and second homes by the sea.
To rank the communes within each department, I used a window function:
ROW_NUMBER() OVER (
    PARTITION BY biens.code_dep
    ORDER BY AVG(ventes.montant) DESC
) AS rank_in_department
The contrasts are sharp even between neighbours: in the Alpes-Maritimes, Saint-Jean-Cap-Ferrat leads with an average sale value of €969,000, far ahead of any commune in the neighbouring Bouches-du-Rhône.
Limits
- One semester only, and an unusual one: the lockdown makes it hard to separate a seasonal effect from a crisis effect, and the delay between agreement and deed hides the lockdown’s real impact on new sales.
- Averages are sensitive to DVF outliers such as bulk sales; medians confirm the rankings, but a cleaning rule on extreme prices per m² would make every average more robust.
- The quarterly comparison counts all property types, houses included.
What I learned
[In your own voice, two or three sentences: for example, what designing the schema before writing any query brought, what the data-type audit taught you, or why you chose not to use cascading deletes.]