
The questions
An online bookshop shared two years of sales data, from March 2021 to February 2023, split across three files: customers, products and transactions. Two requests came with it.
The first came from management: a broad picture of the business. How does revenue evolve over time? Which references sell, and which do not? How is revenue spread across customers?
The second came from Julie, in charge of marketing, with five precise questions about customer behaviour: is there a link between a customer’s gender and the category of books they buy? And between their age and their total spend, their purchase frequency, their average basket and the categories they buy?
- €11.1Mrevenue over two years, excluding B2B
- 8,596customers
- 3,286references in three categories
- 5statistical tests for marketing
Cleaning first
The transactions file contained more than 361,000 completely empty rows, an artefact of the Excel export, which I removed. Joining the three files on customer and product IDs then revealed 21 references that were never sold and 21 customers who never bought anything; I set both aside, and the unsold references came back later in the flops analysis.
The most important decision was about four customers. Each of them had over 2,500 sessions and spent between €114,000 and €326,000, when the best of all other customers spent €5,300. These are clearly business customers, not individuals, and keeping them would have distorted every average. I analysed them separately: together they weigh €884,000, or 7.35% of total revenue, and three references are bought by them alone, which suggests professional pricing.
Revenue: stable, and seasonal
Revenue reached €5.57M in the first year and €5.58M in the second: an increase of under €10,000, essentially flat.
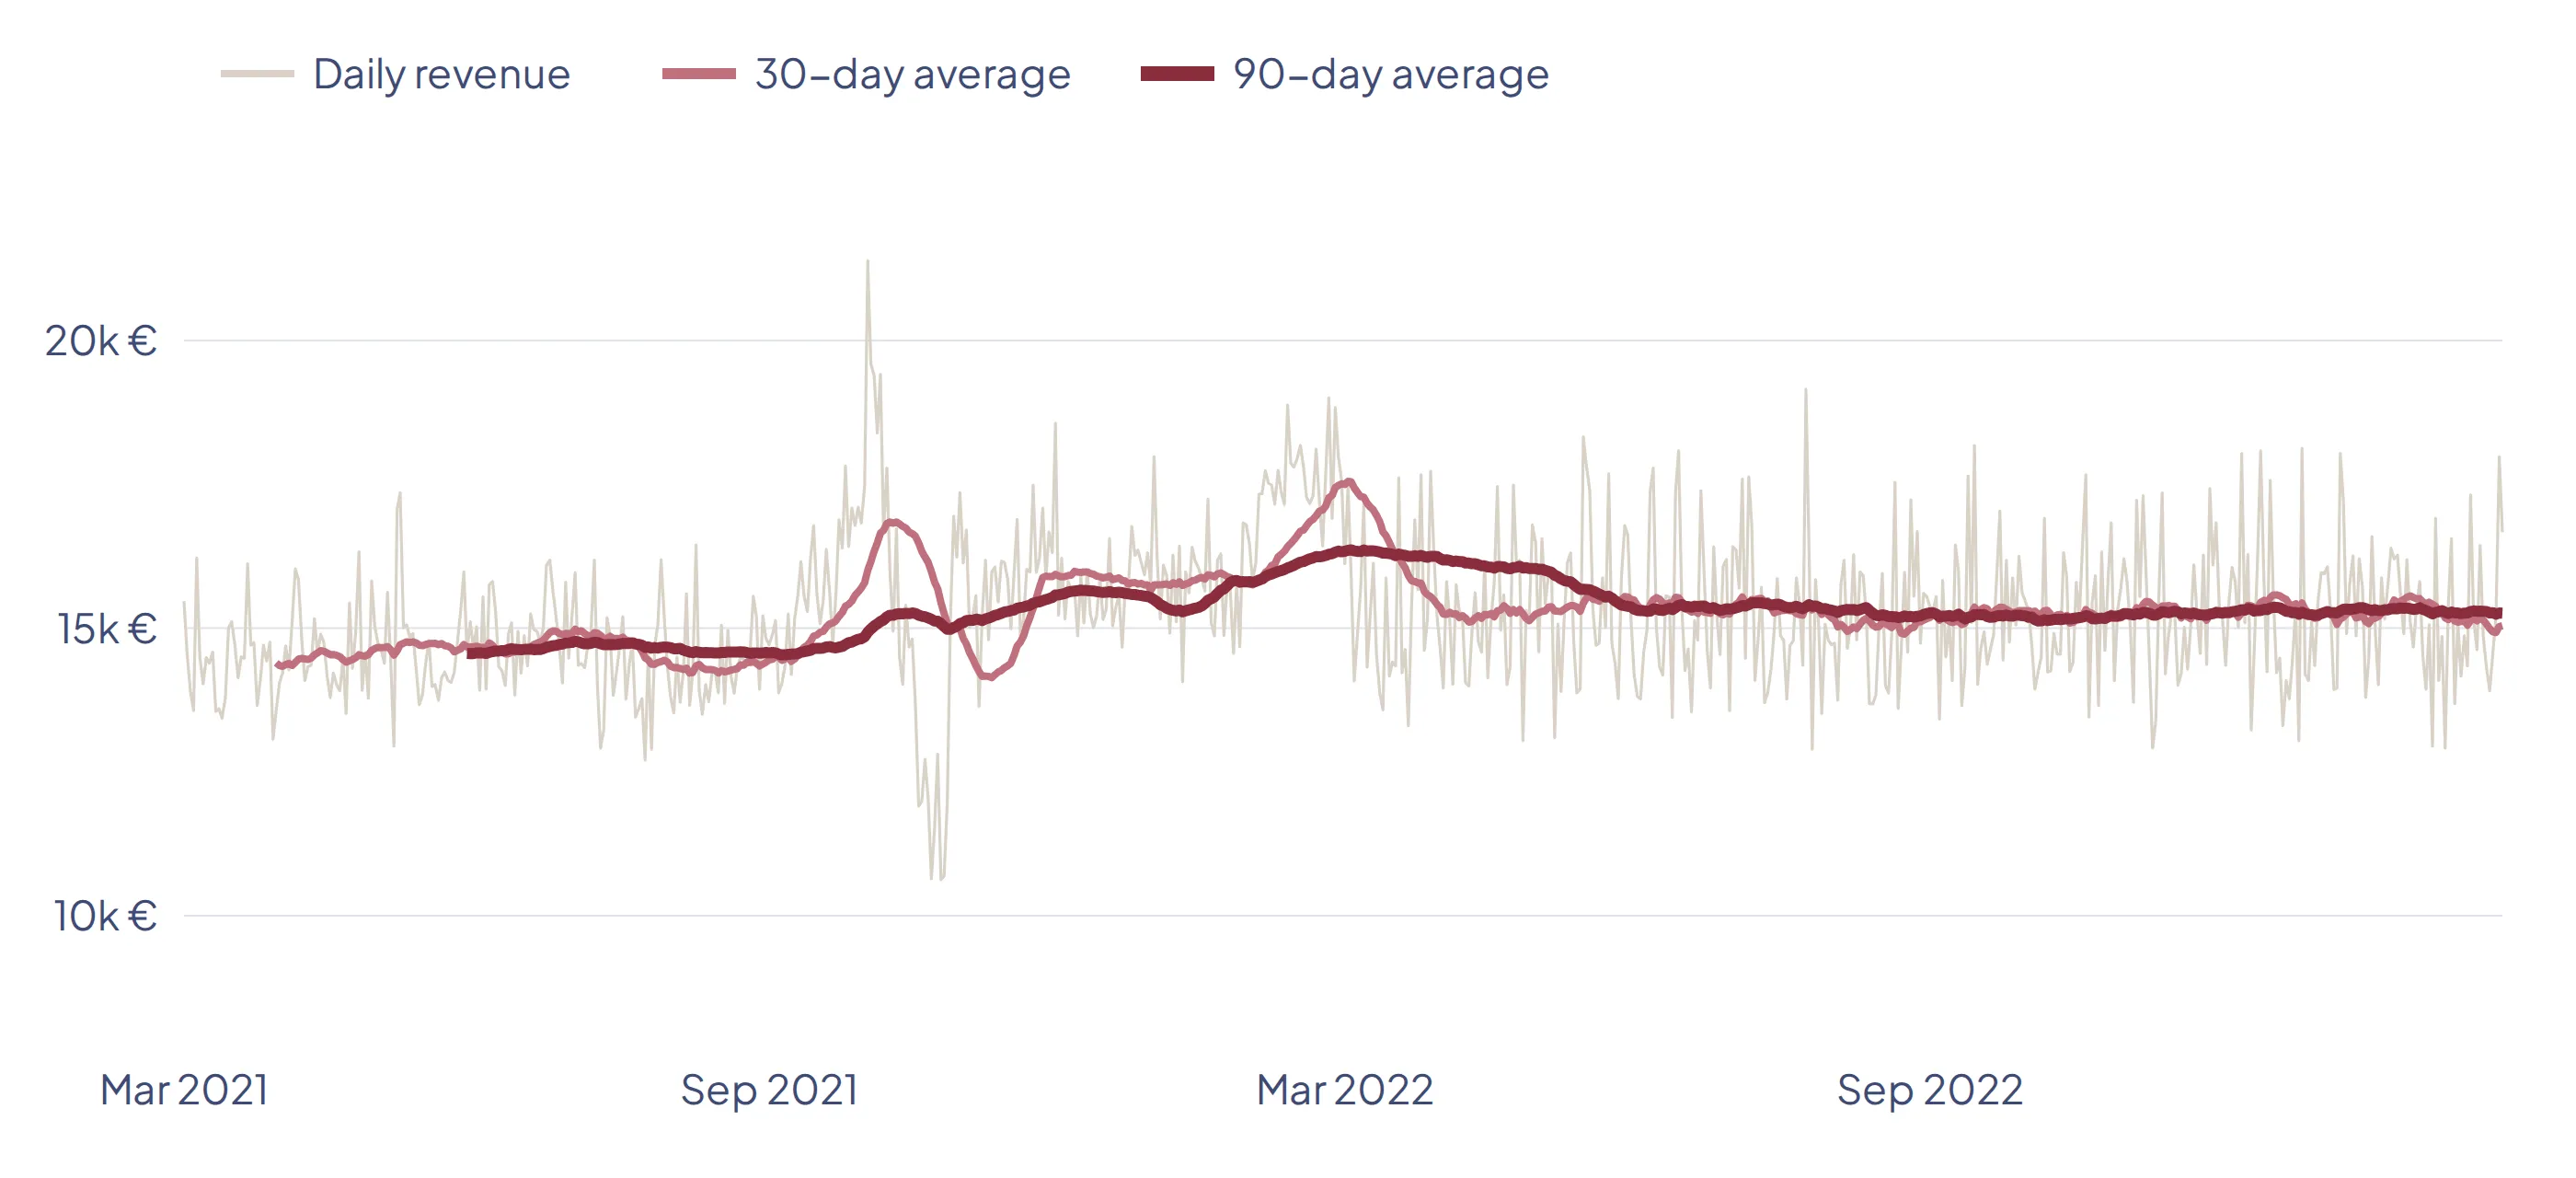
Daily revenue swings between about €12,000 and €20,000. The moving averages smooth out the noise to reveal the trend.
The daily figure is too noisy to read on its own, so I layered two moving averages. The 30-day average reveals the seasonality: a dip in summer, peaks at the start of the school year and before the holidays. The 90-day average shows the underlying trend: a rise until March 2022, then a plateau around €15,000 a day.
Every activity indicator tells the same story of a mature business:
| Monthly average | Year 1 | Year 2 |
|---|---|---|
| Customers | 5,757 | 5,754 |
| Orders | 13,422 | 13,454 |
| Orders per customer | 2.33 | 2.34 |
| Books sold | 26,855 | 26,540 |
| Average basket | €34.58 | €34.54 |
That stability is reassuring, with a loyal customer base, but it is also a warning sign: without new levers, revenue will stagnate.
The catalogue: where the money comes from
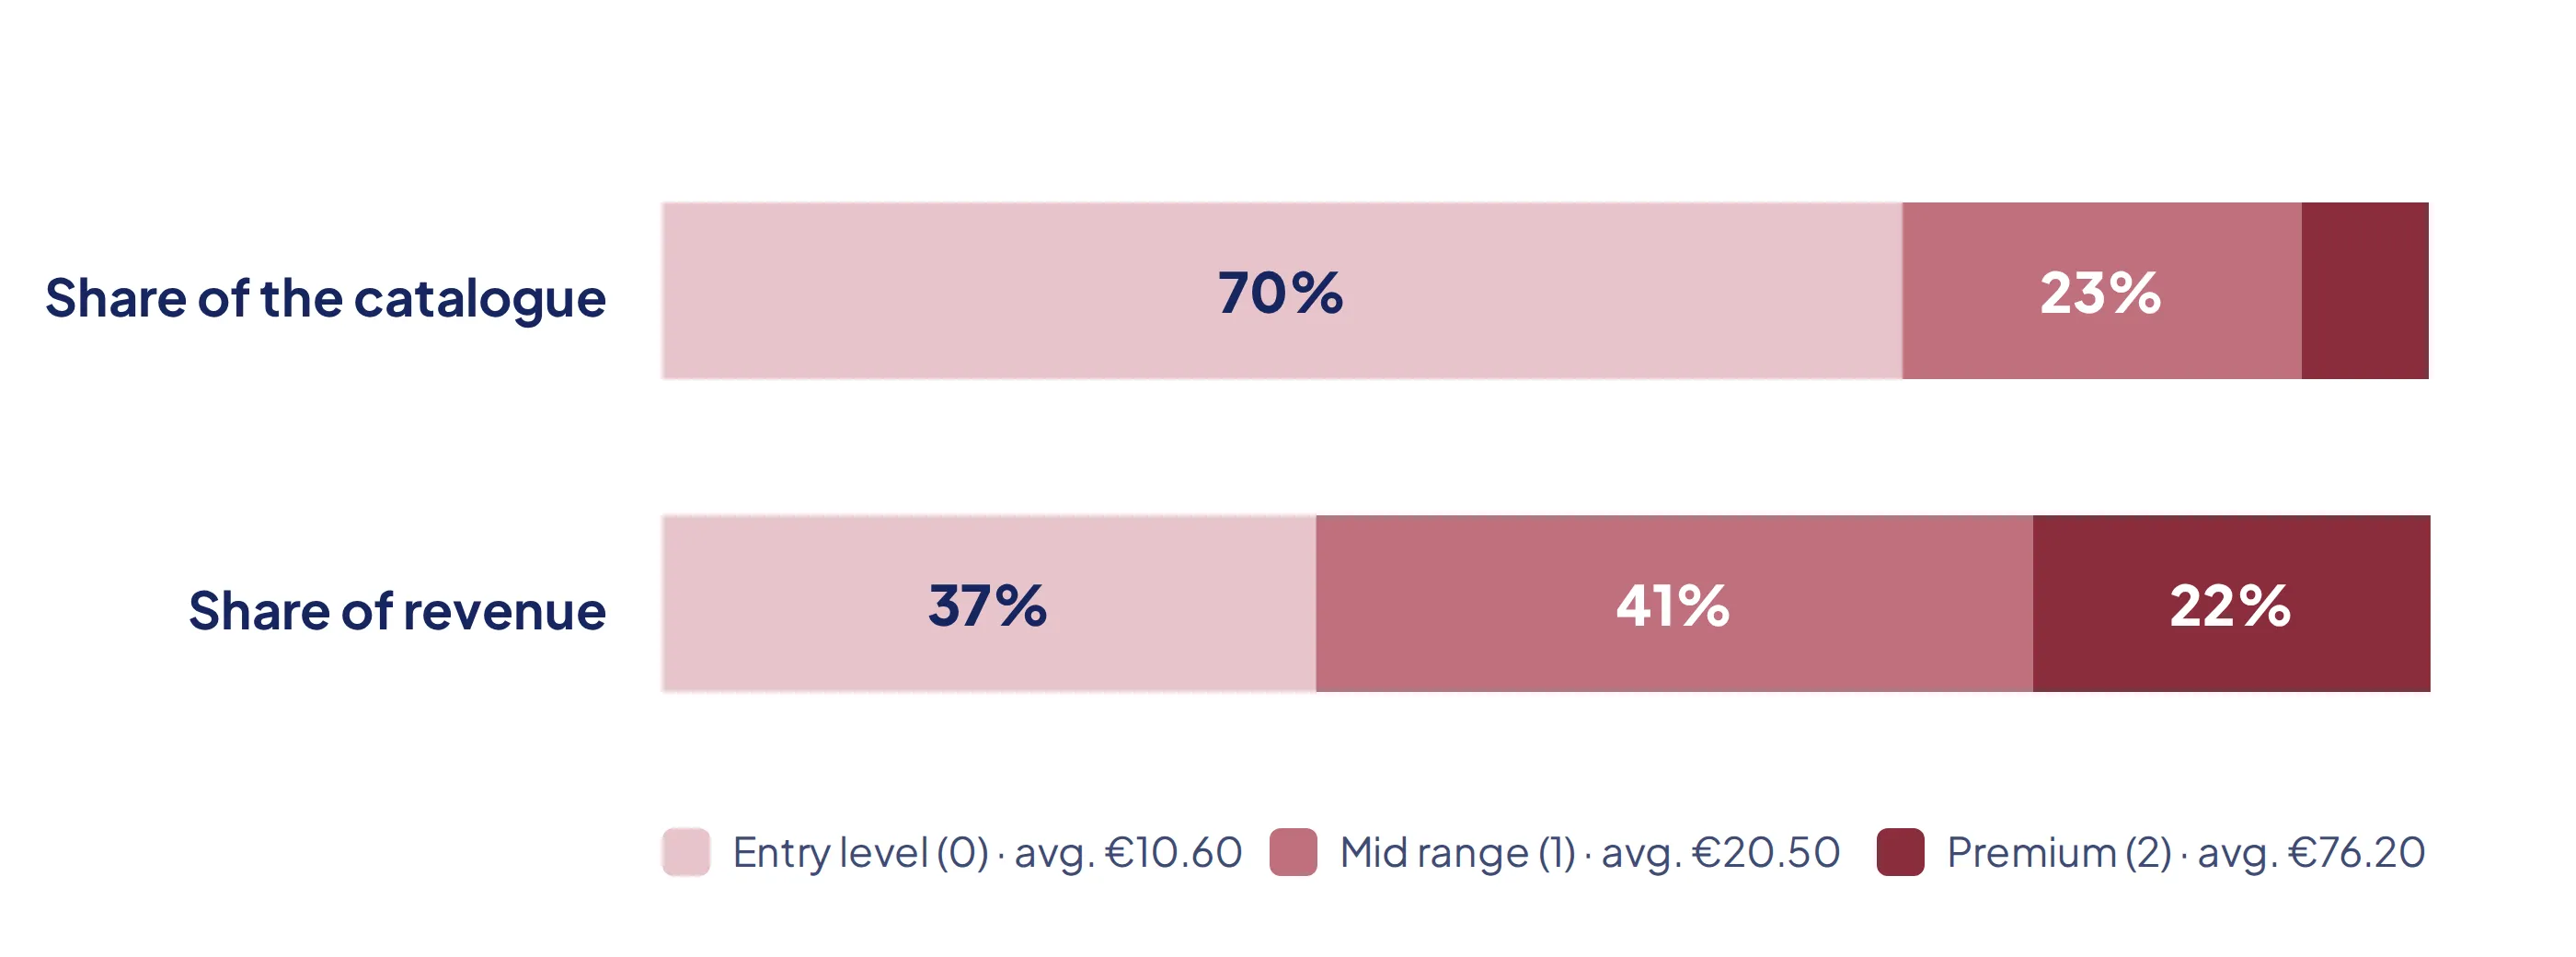
The three categories behave very differently. The entry-level category (average price €10.60) makes up 70% of the catalogue but brings in only 37% of revenue. The mid-range (€20.50) brings in the most revenue: 41% of the total from 23% of references. The premium range (€76.20) is only 7% of the catalogue, but its prices, seven times higher than entry level, earn it 22% of revenue. These proportions stay the same month after month: this is a structural feature of the catalogue, not a seasonal effect.
The concentration follows the Pareto principle almost exactly: 21.5% of references generate 80% of revenue, and 24.8% generate 80% of volume. The top 20 by revenue is made of mid-range and premium titles, led by reference 2_159 at €91,000; the top 20 by volume is entirely mid-range. At the other end, of the 21 references never sold, 16 are entry level, and that category never appears in any top. It deserves an audit.
Customers: a broad, loyal base
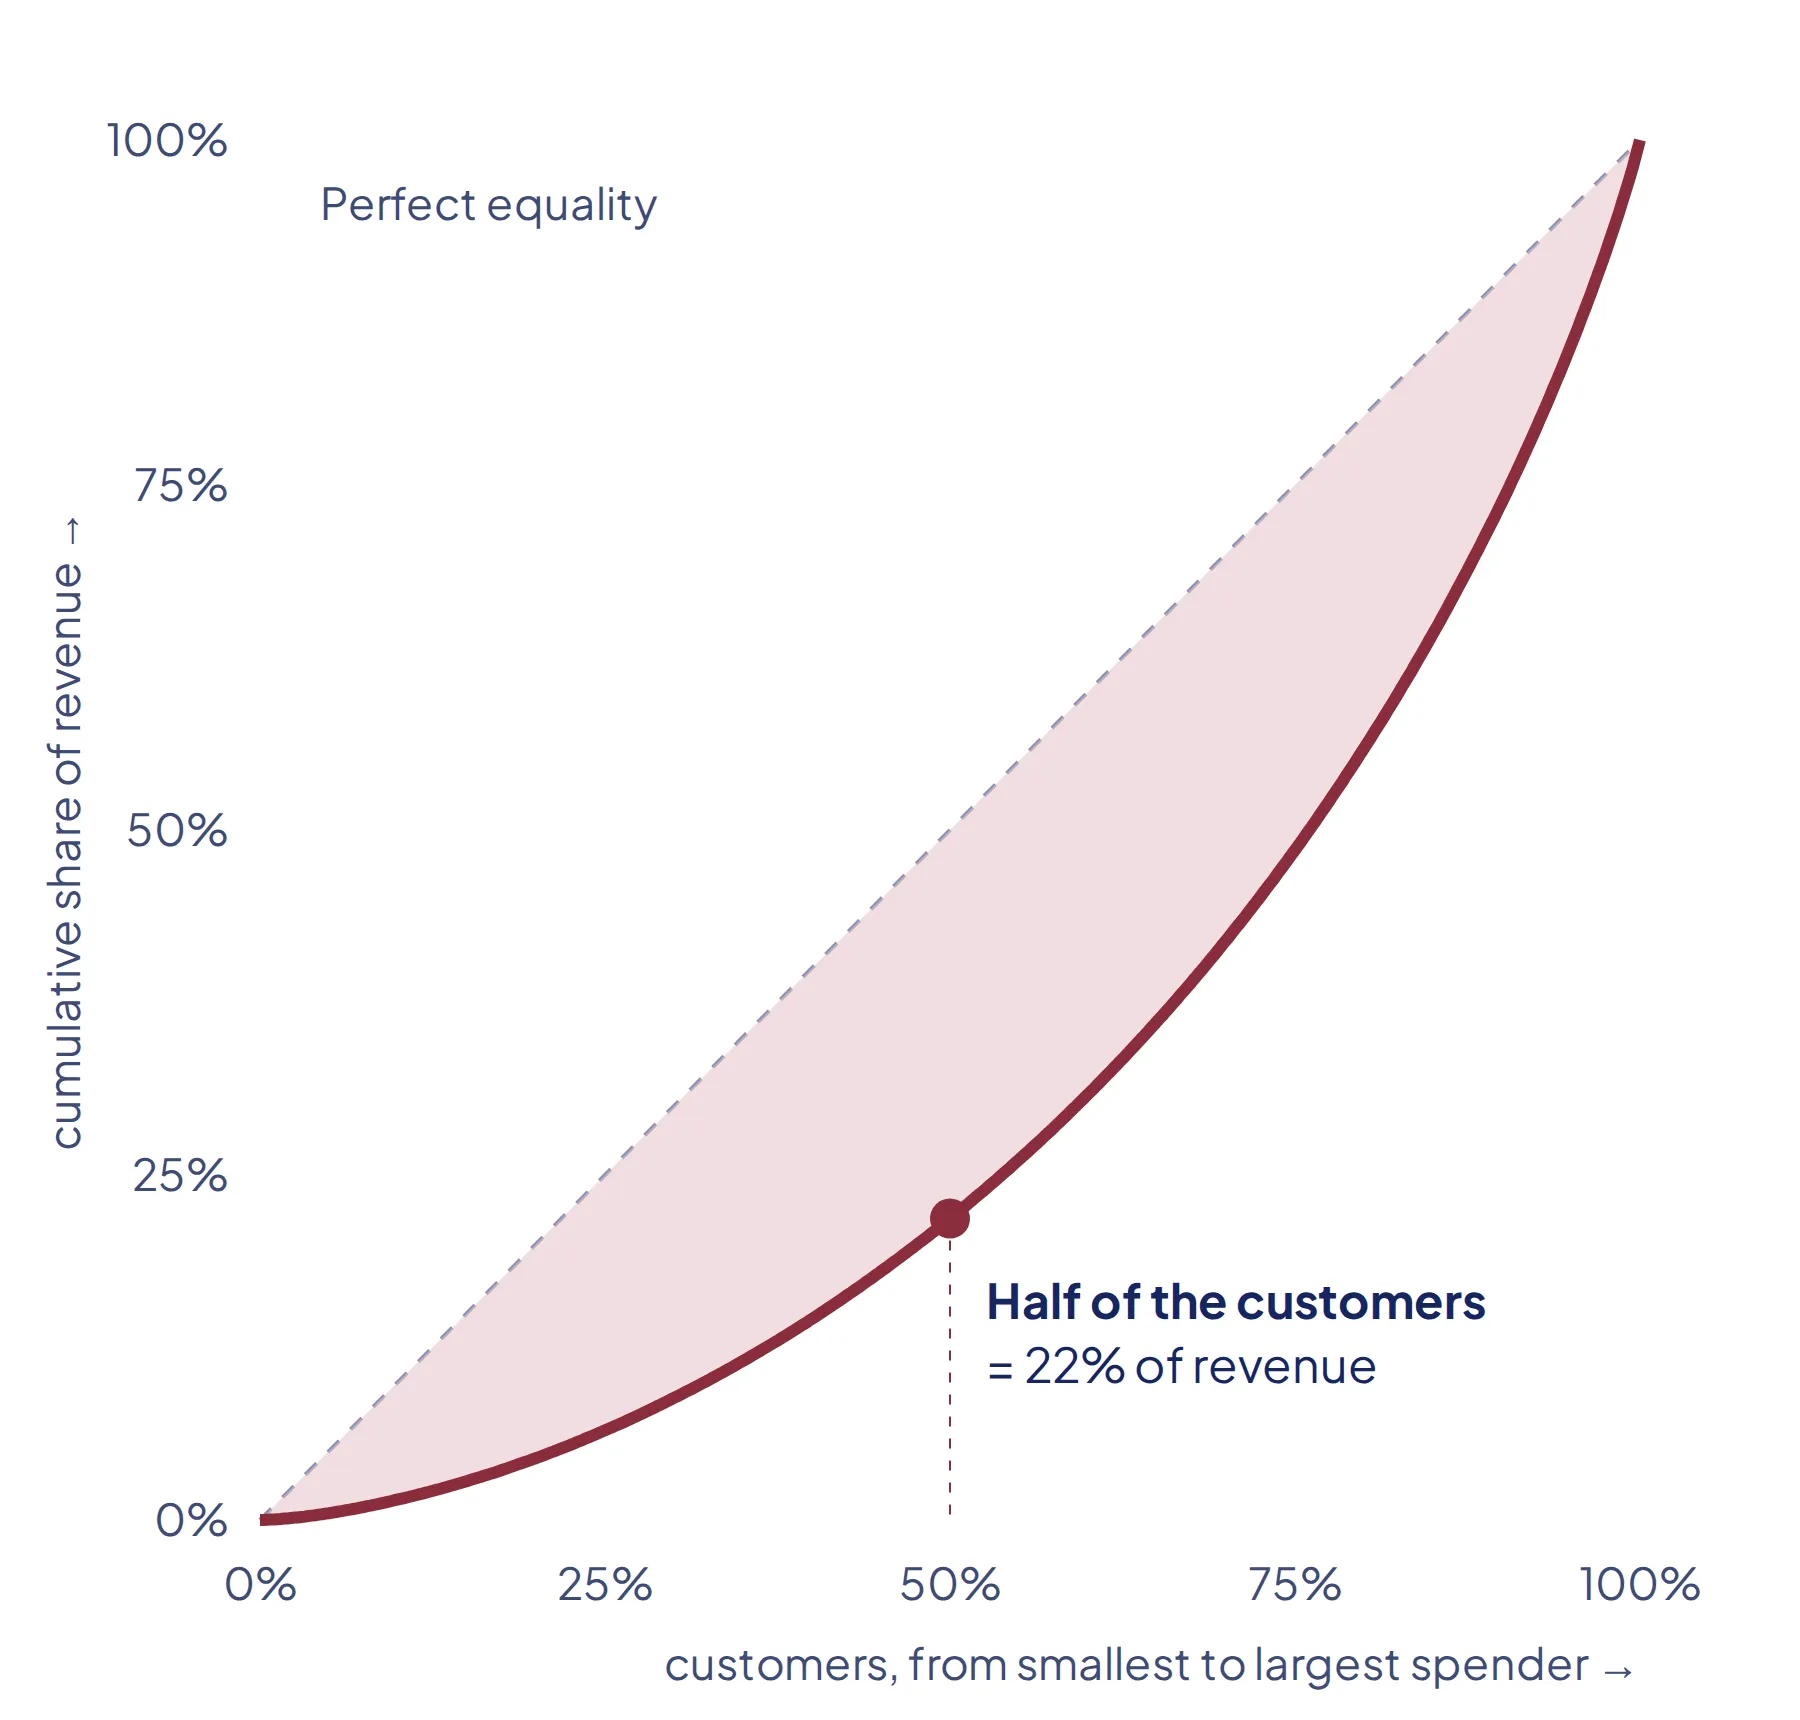
The Lorenz curve shows a moderate concentration (Gini index 0.40): the half of customers who spend the least still generate 22% of revenue, and it takes 52% of customers to reach 80% of it, far from the classic 20/80. Even the top 20 customers are remarkably close to each other, between €4,800 and €5,300 each. The bookshop does not depend on a few star customers, which makes it resilient.
Julie’s five questions
For the statistical tests, one rule mattered above all: independent observations. A customer who buys 150 books must not count 150 times. Every test therefore works at customer level, one row per customer, and for the category questions each customer is assigned the category they buy most.
# One row per customer, with the category they buy most
df_categorie_principale_client = (
    df_merge_transaction_products_customers.groupby(["client_id", "sex"])["categ"]
    .agg(lambda x: x.value_counts().index[0])
    .reset_index()
)
Before measuring correlations between numbers, I checked whether the data followed a normal distribution, which Pearson’s test requires. It does not: age is spread almost evenly and spending is heavily skewed, and the Shapiro-Wilk test (on a sample of 5,000, the limit of the SciPy implementation) rejects normality clearly. I therefore used Spearman’s test, which does not need that assumption.
| Julie’s question | Test | Result | Verdict |
|---|---|---|---|
| Gender × category | Chi-squared | p = 0.086 | No link |
| Age × total spend | Spearman | ρ = −0.18 | No meaningful correlation |
| Age × purchase frequency | Spearman | ρ = 0.21 | No meaningful correlation |
| Age × average basket | Spearman | ρ = −0.70 | Clear negative correlation |
| Age × category | Kruskal-Wallis and ANOVA | p ≈ 0 | Strong link |
Two results needed care. For age against total spend and frequency, the p-values are tiny, so the links are statistically real, but the coefficients stay within ±0.25, the threshold below which I consider a correlation absent. Significant does not mean strong. And for gender, a p-value of 0.086 is close to 0.05, but the threshold is set before the test, not moved after seeing the result.
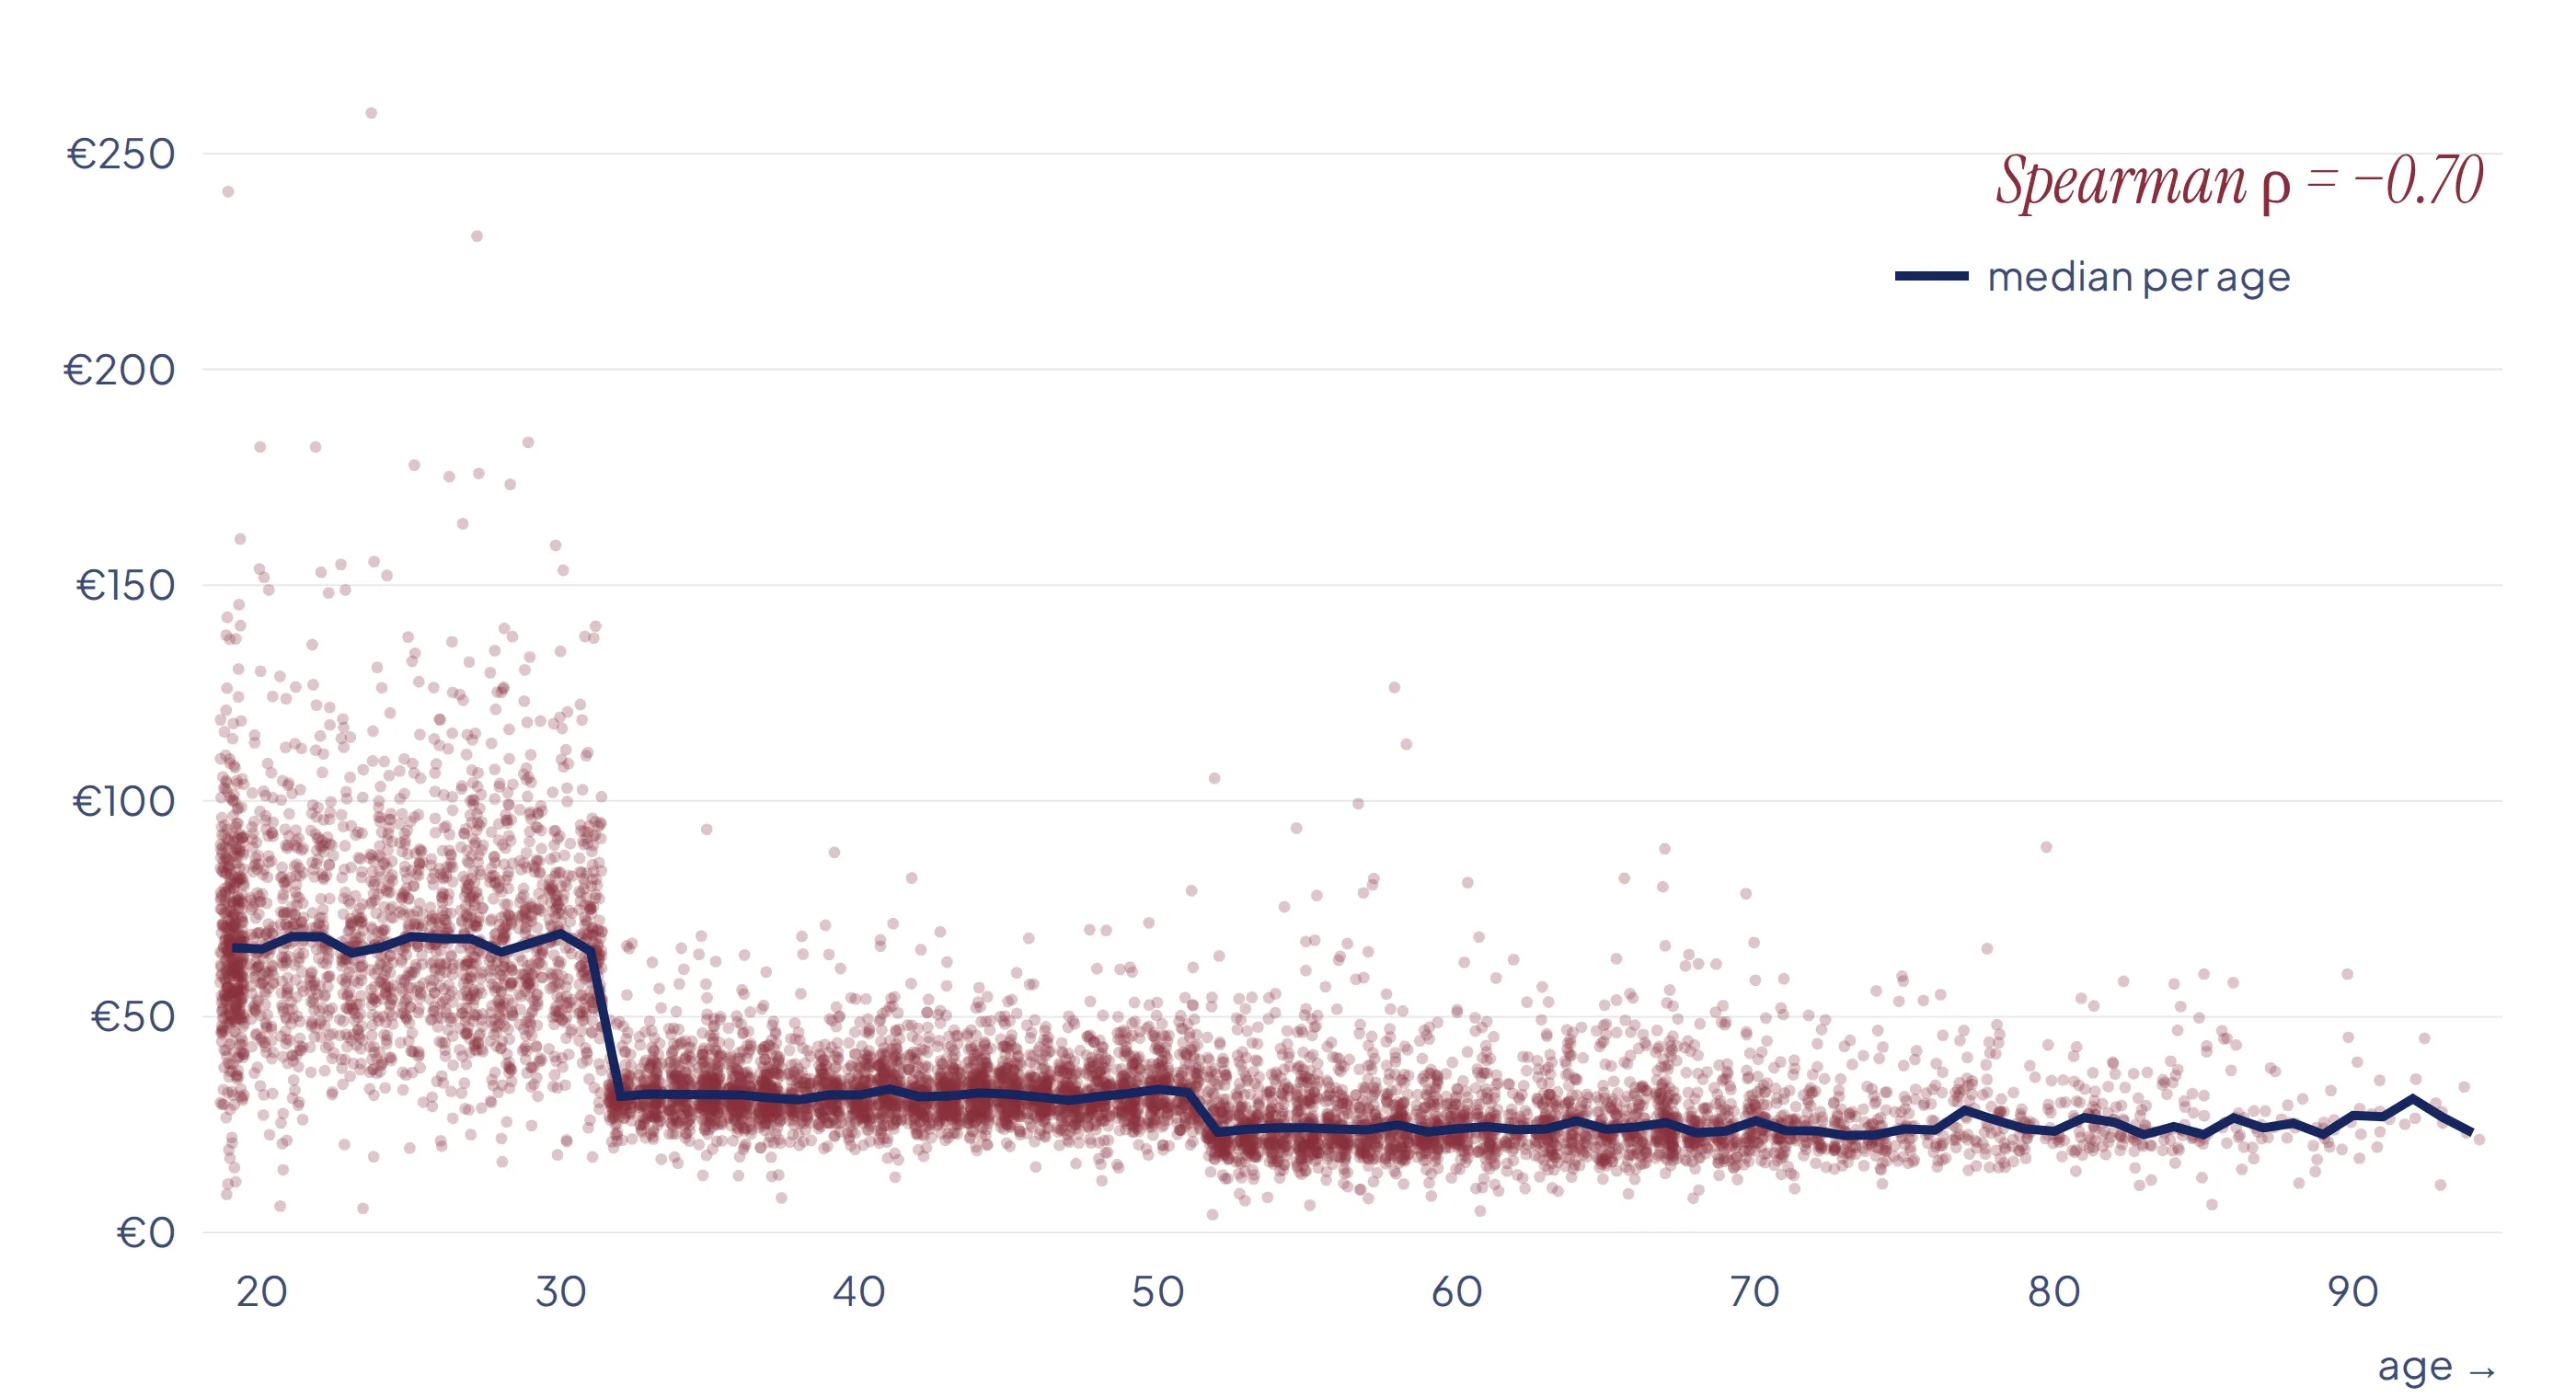
Each dot is a customer. Customers over 70 never exceed €90 per order.
The one strong correlation is between age and average basket. Customers under 30 spend far more per order, with a median around €67 and some baskets above €150, and there is a clear break around 30, beyond which most baskets fall to €20–40.
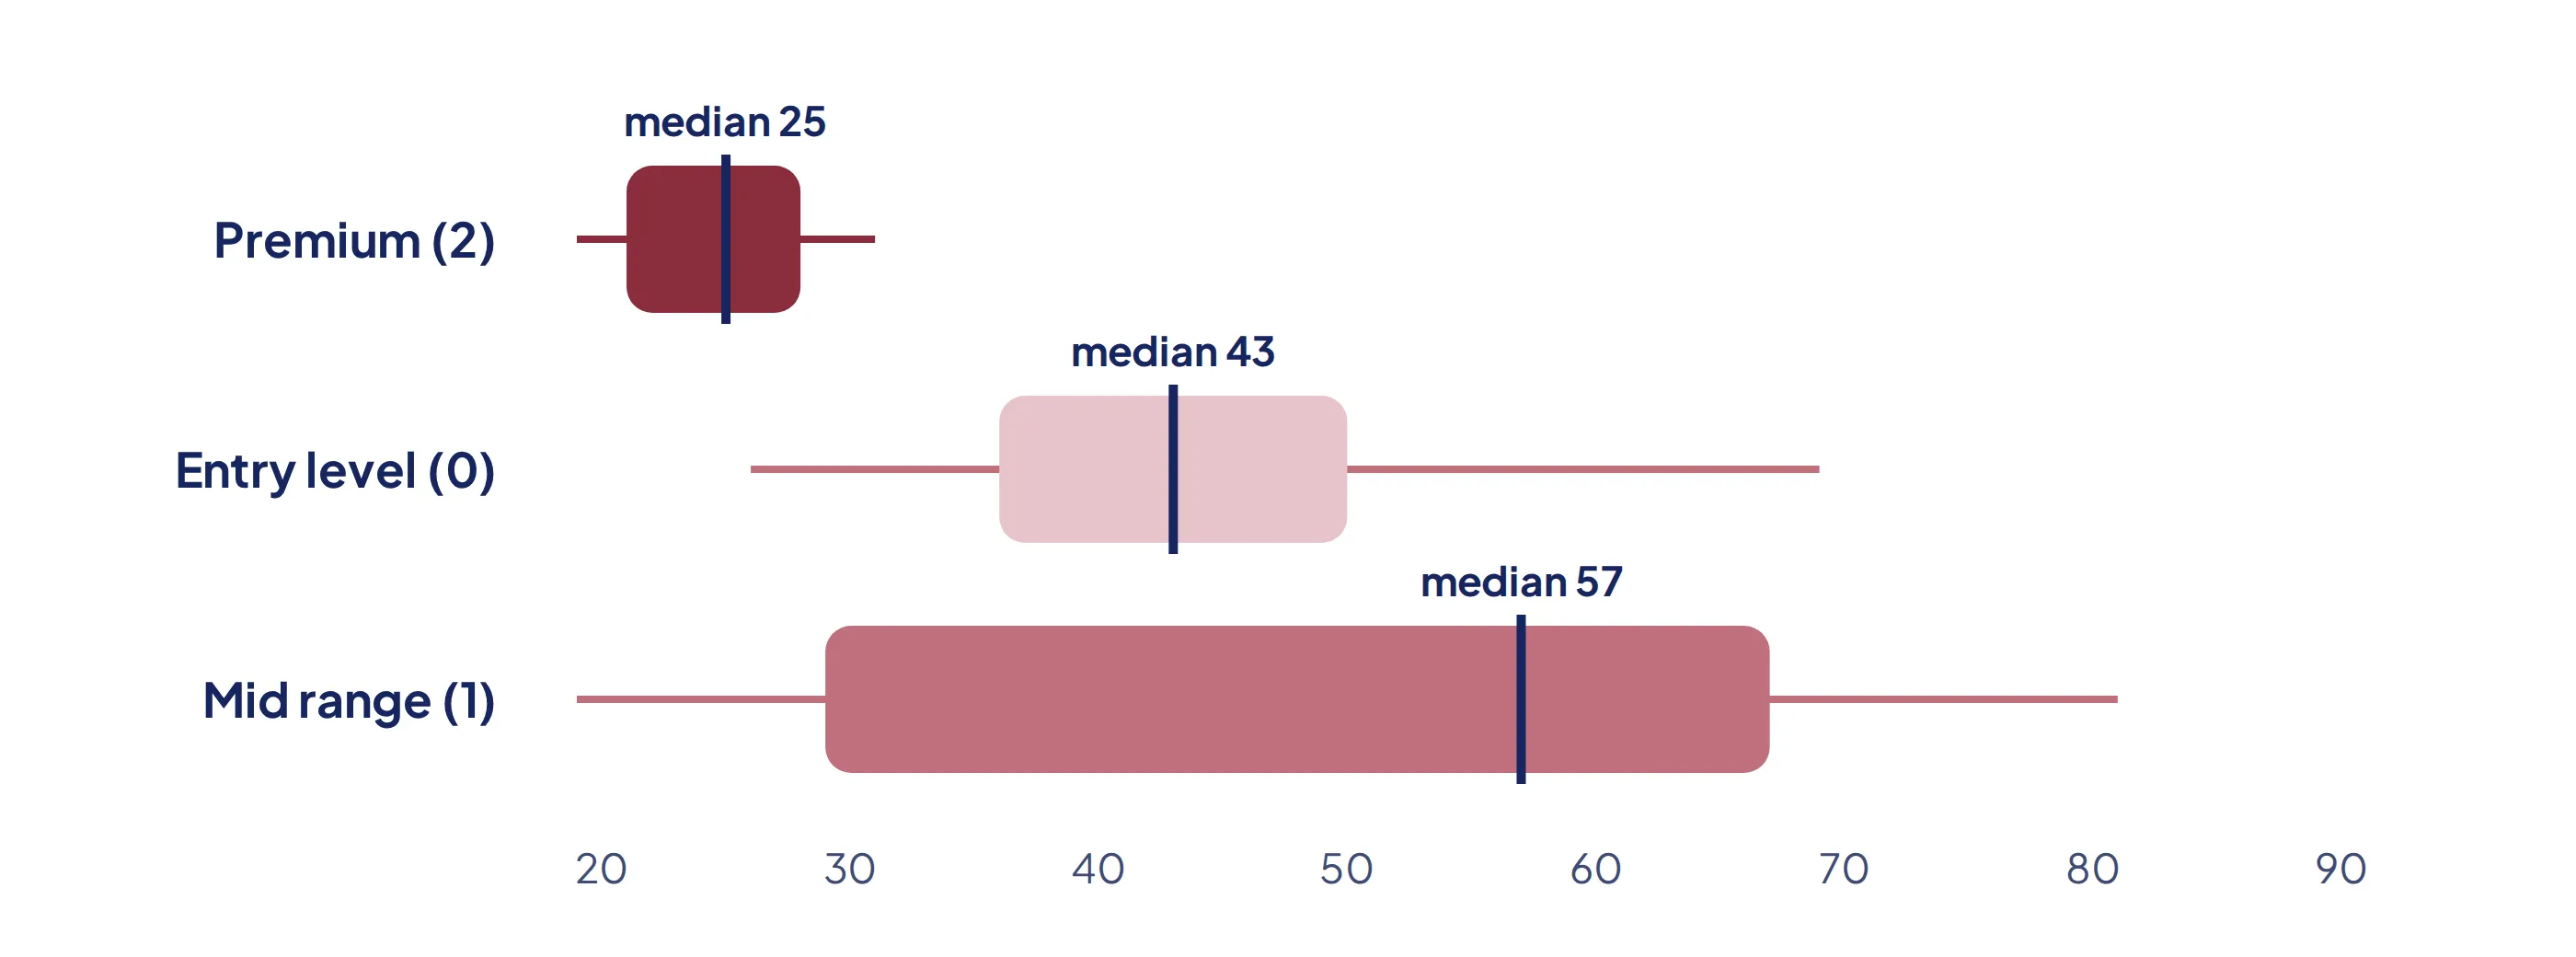
Age also separates the categories sharply: premium buyers have a median age of 25, entry-level buyers 43, mid-range buyers 57. I ran a Kruskal-Wallis test, the most appropriate since the data is not normal, and an ANOVA as a robustness check, justified by the sample size; both reject the null hypothesis with p-values close to zero.
Recommendations
- Stop segmenting where it does not pay. No significant link was found between gender and categories, and age barely affects total spend or frequency: universal campaigns are as effective and much cheaper to produce than dozens of segmented ones.
- Target the under-30s for the premium range, the segment that buys it and spends the most per order.
- Raise the basket of the over-30s with upselling, bundles or payment facilities.
- Audit the entry-level category, 70% of the catalogue, absent from every top and home to 16 of the 21 references never sold, and put the star references forward instead.
- Develop the B2B segment, already 7% of revenue from four customers, with professional pricing on the references they buy.
Limits
- Correlation is not causation. Age is linked to basket size, but the data does not say why.
- Age is approximate, computed as 2023 minus the year of birth.
- The ±0.25 threshold for calling a correlation meaningful is a convention from my course; other references use different cut-offs, which would not change the one strong result.
What I learned
[In your own voice, two or three sentences: for example, why you worked at customer level for the tests, what “significant does not mean strong” taught you, or how you would explain a p-value to a marketing team.]