
The question
Bottleneck is an online wine and spirits shop. Its head of sales, Nicolas, put it simply: the tools are home-made, the data is hard to analyse and stock management is complicated. He sent me three exports for October and a brief in two phases:
- Reconcile the files and find the errors in them, at least eight, with solutions to clean up the systems.
- Analyse the data for the management committee: revenue, top products and the 80/20 rule, price outliers, margins, stock rotation and correlations.
I presented that analysis in March 2026. Six months later, the final project of my training asked me to audit this deliverable with AI, critically and with the method documented. The audit found that two of the figures I had presented were wrong. This case study tells both stories: the analysis, and what happened when I checked it.
- 3 monthsof stock on average, not the 35.6 months I first presented
- €119,666revenue excl. VAT in October, from 713 products online
- 27products, mostly champagnes, tie up nearly 40% of the stock value
- 10validation rules run every time the exports are loaded
Three exports that don’t share a key
| File | Content | Rows |
|---|---|---|
| ERP export | Product ID, selling price, purchase price, stock quantity and status, sold online or not | 825 |
| Website export (WordPress) | SKU, sales over the month, name, type, publication date | 1,513 |
| Link table | ERP product ID against website SKU, since the two tools number products differently | 825 |
The website export lists almost every product twice, once as a product page and once as an image page. Between that, the link table and the ERP, the files hid at least ten kinds of anomalies:
- 3 negative prices and a price ten times too low: a bottle bought at €77.48 and sold at €12.65.
- 2 negative stocks, −10 and −1, and 2 stock statuses that contradict their quantity.
- 85 website rows without a SKU, two of them with negative sales of −56 and −17.
- 4 products whose two rows do not show the same sales: the product page and the image page give two different figures.
- A SKU with a suffix,
13127-1, which turned out to be a real product variant. - 3 products declared online in the ERP that have no website ID in the link table.
- A product listed on the website, with 33 bottles in stock, that the ERP declares offline.
Of the 734 ERP products that have a website ID, 714 are found in the website export, a 97.3% match rate, and 713 of them are sold online.
What I presented in March
Revenue reached €143,424 including VAT. It took 433 products, 61% of the catalogue, to make 80% of it: no star products, a business that lives on the breadth of its range. Champagnes and premium wines led revenue, while entry-level wines led volume. Spirits had the best margins, 82% on cognacs and whiskies, champagne only 40%. Price and sales were negatively correlated (−0.52), sales and stock positively (0.44).
And on stock, my conclusion was alarming: an average rotation of 35.6 months, about three years, champagnes needing up to 375 months to sell at the current pace, a stock worth €493,872, and one champagne sold at a loss of −86%.
Auditing my own work with two AIs
The audit had to be critical, documented, and compare several tools. I gave Claude and Gemini the same documents: the brief, the source files, my presentation and my notebook. Only their posture changed.
- Claude acted as an internal auditor. It had helped me on the original project, and the prompt said so: it was reviewing work it had taken part in.
- Gemini acted as an external auditor. The prompt presented the notebook as a student’s work, with no link to it.
The reason was a risk I wanted to control: an auditor reviewing work it took part in may be tempted to validate it. The independent audit was there to catch that bias, and to test how self-critical Claude would be.
| Claude | Gemini | |
|---|---|---|
| Findings | 15 | 10 |
| Errors found behind the figures shown to the client | 2 of 2 | 0 of 2 |
They shared 6 findings and disagreed on the severity of all six. Claude kept its high severity for what distorted a result shown to Bottleneck. Gemini gave it to anything that broke data integrity or code: an absolute file path got its highest rating. Each one missed what the other saw, but not with the same weight: Gemini missed both errors behind the figures I had presented, while Claude missed two real quality signals that changed no result, the negative stocks set to zero and an outlier test run across categories that should not be compared.
Then I had each model review the other’s audit, and checked every disputed point on the data instead of taking a vote.
- Gemini called my handling of the four imperfect duplicates a “falsification”: I had kept the lower sales figure. In the data, all four high values sat on the image rows, the low ones on the product pages. Keeping the high values would have inflated revenue by €10,068 including VAT.
- Gemini thought the three negative prices could be refunds, and that by making them positive I had erased information. I checked: without the minus sign, each of these prices is about twice its purchase price (ratios of 1.94, 1.84 and 1.97), like the rest of the catalogue (1.93 at the median). They are sign errors.
- Gemini approved one of Claude’s findings without checking it. Claude had noted that my margins by category were simple averages that ignored the quantities sold. But Claude had run the numbers in the meantime: weighted by quantity, no category’s margin moves by more than 1.3 points. The finding changed nothing, and Claude had dropped it; Gemini approved it without recomputing.
In their revised audits, Claude added the negative-stock finding it had missed and dropped the one that did not hold. Gemini dropped three findings it had defended a step earlier, without explaining why, aligned its severities on Claude’s, and lost the two contributions of its own that were right. The two audits ended up agreeing, but because Gemini lined up behind Claude, not because it had checked.
The two figures that were wrong
Stock coverage was multiplied by 12. To turn sales into a monthly rate, I had divided them by 12. But the export already covered a single month, so every coverage came out twelve times too long, and the average reached 35.6 months. Rebuilt, with the never-sold products set apart, it is 2.98 months (2.4 at the median). The diagnosis flipped from a critical overstock to a stock that turns in about three months, apart from a few products that barely sell, or not at all.
Products that never sold disappeared from the ranking. For a product that sold nothing, coverage cannot be computed: you cannot divide by zero sales. My code mishandled these products in two ways:
- when stock was left, the calculation gave an infinite result, which I replaced with 0. The product then looked like the fastest-moving of all, when it was not moving at all. That was the case for 3 products, holding €14,959 of stock;
- when there was no stock, the calculation gave 0 divided by 0, an empty value that the average skipped without a warning. That was the case for 22 products.
In all, 25 never-sold products appeared nowhere in the analysis.
# First version: sales already monthly, and no sale turned into "0 months"
df_web_join['rotation_stock'] = df_web_join['stock_quantity'] / (df_web_join['total_sales'] / 12)
df_web_join['rotation_stock'] = df_web_join['rotation_stock'].replace([np.inf, -np.inf], 0)

# Rebuilt version: no sale means no coverage, and never-sold products get their own category
d["coverage_months"] = d["stock_quantity"] / d["total_sales"].replace(0, np.nan)
d["never_sold"] = d["total_sales"] == 0
Other figures moved for less dramatic reasons:
| Indicator | March | Now | Why |
|---|---|---|---|
| Average stock coverage | 35.6 months | 3.0 months | Sales were already monthly, and never-sold products no longer count as 0 |
| Revenue | €143,424 incl. VAT | €119,666 excl. VAT | Excluding VAT, the basis of the purchase prices; the €25 gift card the first version deleted is kept |
| Stock value | €493,872, at selling price incl. VAT | €277,225, at purchase price excl. VAT | Stock is valued at what it cost, not at what it might bring in |
| Product sold at a loss | 1, at −86% | 0 | A decimal slip: the price is €126.50, not €12.65 |
| Price and sales | −0.52 | −0.71 | Spearman instead of Pearson, on prices that range from €4 to €188 |
| Stock and sales | 0.44 | 0.76 | Same reason |
| Never-sold products identified | 0 | 25 | See above |
| Corrections hard-coded on product IDs | 8 | 0 | Fixed by rule instead |
Why Spearman rather than Pearson? Pearson measures a straight-line relationship, and a few extreme values are enough to throw it off. Prices here range from €4 to €188 excl. VAT, and a few very expensive bottles sit far from all the others. Spearman works on ranks: it checks whether the most expensive products are also the ones that sell least, without the exceptional bottles weighing more than the rest. The link between price and sales is stronger than Pearson showed.
A pipeline that checks every export
The audit also showed that my first notebook only worked on October’s export: eight corrections were written against specific product IDs, and every quality check was a printout nobody had to read. Yet my own conclusion had recommended automating the cleaning. So I wrote a specification before touching the code.
| Stakeholder | Decides | Needs |
|---|---|---|
| Purchasing and stock manager | Order, clear or drop a product | A prioritised list, with the amounts at stake |
| Management | Where the margin is made, and where capital sleeps | Financial indicators that are stable from one month to the next |
| E-commerce manager | Whether the online catalogue is consistent | Price anomalies and ERP / website mismatches |
The goal: run on the three raw exports every month, and stop rather than produce a wrong figure when the data is degraded. For each need the audit raised, I compared several options and tested them on the real data before choosing.
| Need | Options compared | Chosen | Why |
|---|---|---|---|
| Check data quality automatically | pandas assertions, pandera, Great Expectations | pandera | Great Expectations, too heavy for 825 rows a month, was ruled out from the start. The other two tools caught the 4 errors I had slipped into a copy of the export. pandera wins: the check cannot be forgotten, and the code is shorter (39 lines against 57) |
| Catch mistyped prices | IQR, robust z-score (MAD) and Isolation Forest, tested on the price, then on the selling / purchase price ratio | MAD on the ratio, threshold 5 | On the price alone, no method found the real errors: they mostly flagged expensive bottles. On the ratio, all three found the 4 errors, but the IQR raised 45 alerts, against 7 for the MAD. Isolation Forest needs to know in advance how many anomalies to look for, which is impossible on a new export |
| Turn findings into actions | ABC classification, K-means, a table crossing coverage and stock value | Coverage × stock value | With ABC, 60% of the catalogue would have been class A, so a priority: priority no longer meant anything. K-means mostly found price ranges, with blurry groups. The catalogue is too even for both methods |
After the test, I added two rules, on negative sales and on counting the rejected rows: ten rules in all.
The rules run at two levels. Blocking rules stop the processing when a file cannot be used: a duplicated ID, a missing price, a value outside its domain, or fewer than 95% of the linked products found in the website export. Alert rules let the month’s analysis go ahead and report the problem: three mistyped prices should not stop the whole report.
| Rule | What it checks | If it fails |
|---|---|---|
| R1 | Each product appears only once, in the ERP and on the website | Stop |
| R2 | Each product has a positive selling price, once explainable entry errors are fixed | Stop |
| R3 | Each purchase price is above zero | Stop |
| R4 | The selling price stays within the catalogue’s usual range relative to the purchase price | Alert |
| R5 | Stock is filled in; a negative stock is reported, then set to zero for the calculations | Alert |
| R6 | The stock status is “in stock” or “sold out”, and matches the quantity | Stop if the value is unknown, alert if it contradicts the quantity |
| R7 | ”Sold online” is 0 or 1 | Stop |
| R8 | At least 95% of the linked products are found in the website export | Stop |
| R9 | No sale is negative | Stop |
| R10 | Every rejected row is counted and reported | Report |
With pandera, each rule takes one line, next to the column it checks. Here are the blocking rules on the ERP export:
class ERPSchema(pa.DataFrameModel):
    """Blocking rules on the ERP export: if one fails, processing stops."""

    # R1: a product ID can appear only once
    product_id: Series[int] = pa.Field(unique=True)
    # R2: every product must have a selling price
    price: Series[float] = pa.Field(nullable=False)
    # R3: the purchase price must be strictly positive
    purchase_price: Series[float] = pa.Field(gt=0)
    # R6: the stock status can only be "instock" or "outofstock"
    stock_status: Series[str] = pa.Field(isin=["instock", "outofstock"])
    # R7: "sold online" can only be 0 or 1
    onsale_web: Series[int] = pa.Field(isin=[0, 1])
Entry errors are now fixed by rule, not by ID. A price is only corrected when changing its sign or its scale brings it back into the catalogue’s usual range of 1.4 to 3 times the purchase price. Anything no rule explains is reported, not fixed. And no row is dropped silently: the 797 rows that are not product pages, the 2 products without a SKU and the 3 online products without a website ID are all counted or reported.
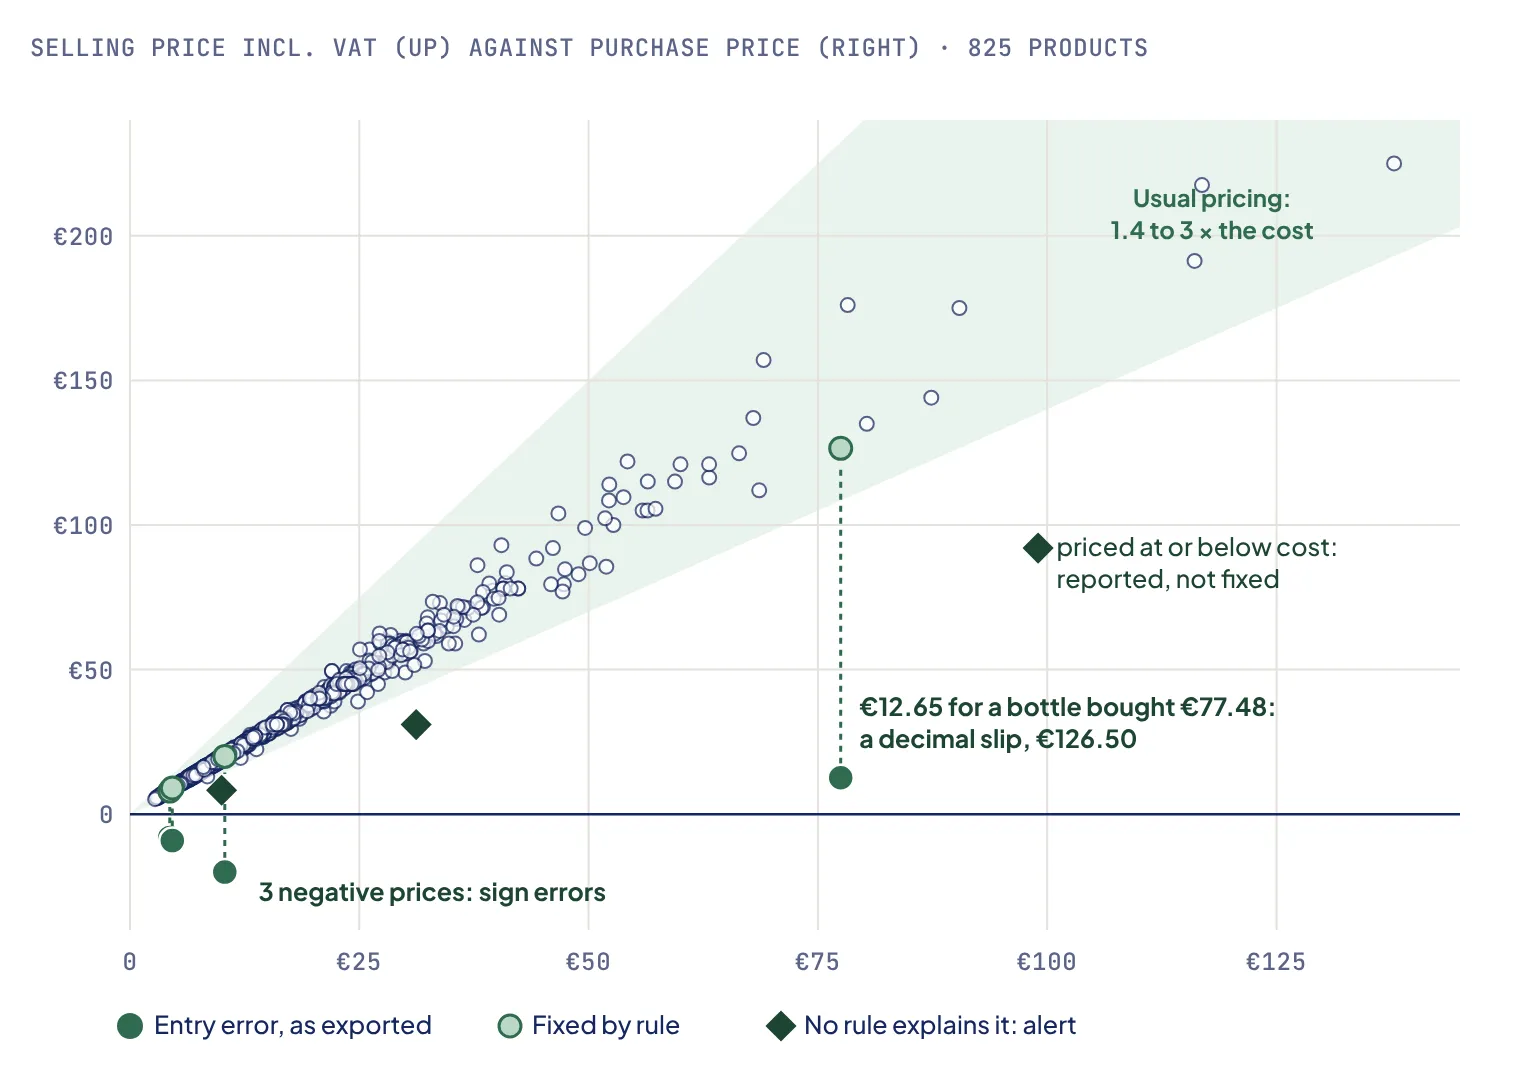
The most expensive bottles look like outliers on price alone, but they sit inside the band like everything else. The ratio isolates the 4 entry errors, fixed automatically, and 3 products priced at or below cost, which no rule explains: they are reported, not fixed.
Where the capital sleeps
With the coverage fixed, most of the catalogue turns in one to six months. The problem is concentrated.
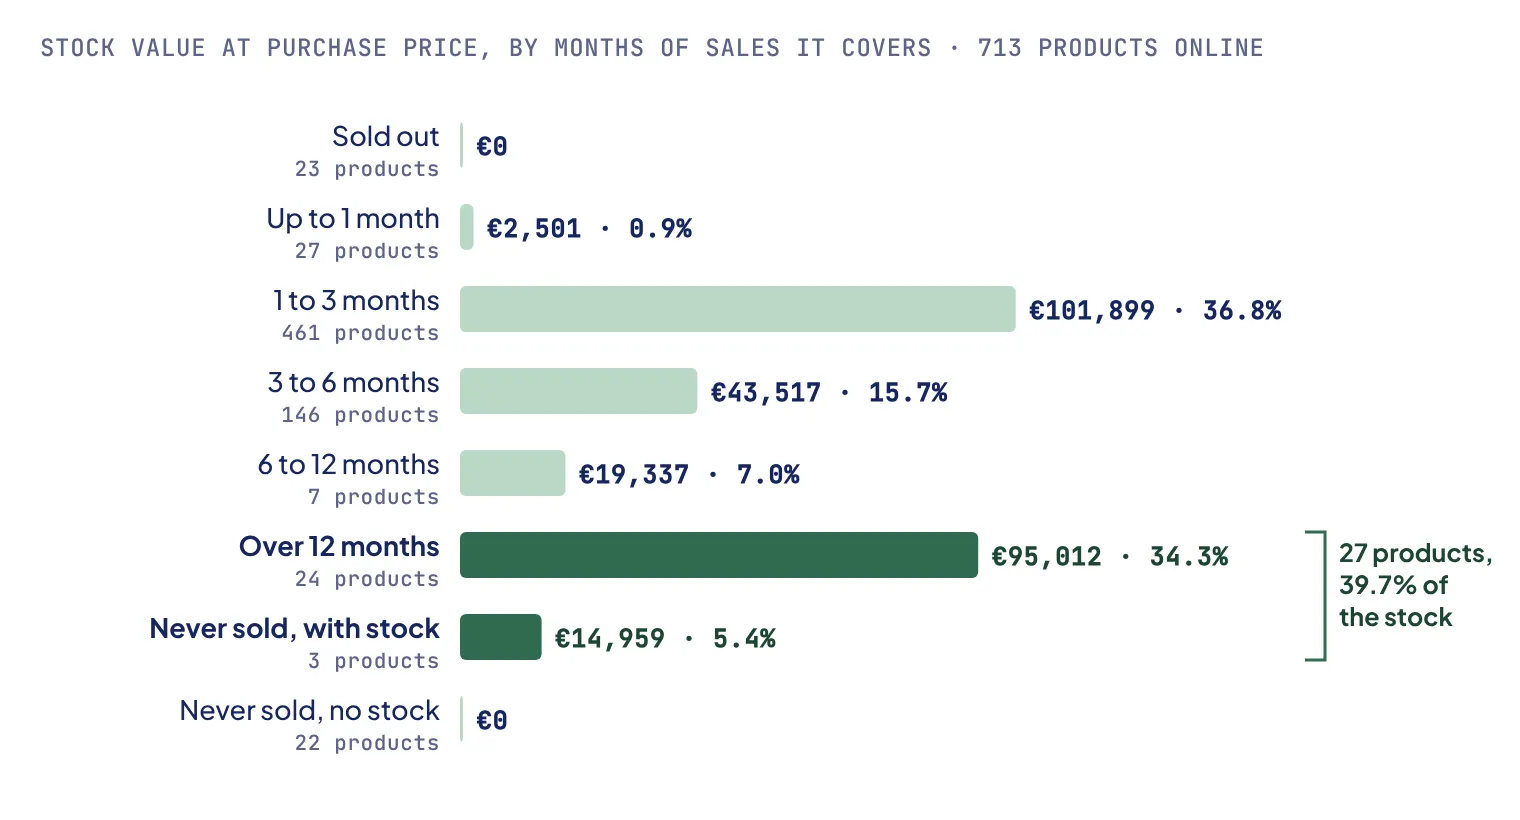
Most of the catalogue sits in the one-to-six-month bands. The two dark bars are where the capital sleeps: products that cover more than a year of sales, or never sold at all.
24 products cover more than a year of sales, €95,012 at purchase price. Add the 3 products that held stock but sold nothing, and 27 products tie up nearly 40% of the stock value.
They are mostly grower champagnes, and also among the least profitable products: their markup sits between 36 and 41%, against 61% for the catalogue’s median product. The capital sleeps where the margin is thinnest.
At the other end, 23 products sold out after selling 194 bottles in October, €5,516 excl. VAT. Until they are restocked, those sales are lost.
Finally, 22 products had neither sales nor stock. They could not sell anything: the question is whether they are discontinued, which is for the buyer to answer, rather than counting them as dormant stock.
Recommendations
- Suspend restocking of the 24 dormant products, €95,012 at purchase price, starting with the champagnes, after checking whether they are waiting for the year-end season.
- Decide on the 3 products that never sold but hold €14,959 of stock, starting with the Egly-Ouriet Blanc de Noirs: its price was entered at €12.65 instead of €126.50.
- Reorder the 23 sold-out products, and the 27 with a month of stock or less left.
- Check whether the 22 products with neither sales nor stock are discontinued, and take them off the website if so.
- Fix the data at the source: the 3 products priced at or below cost, the 2 statuses that contradict their stock, the 3 online products missing from the link table, and the product on the website that the ERP declares offline.
Limits
- One month of data. There is no seasonality, and October comes right before the year-end peak: a dormant champagne may just be waiting for Christmas. A year of exports would let the coverage be smoothed.
- VAT is not in the files. I assumed 20%, the standard French rate on wine and spirits, kept in a single constant. The three olive oils normally carry the reduced 5.5% rate.
- The thresholds are conventions: 1 month to reorder, 12 months for dormant stock, a MAD score of 5 for prices. They should be set with the buyer, based on supplier lead times.
- The 109 products the ERP declares offline are not analysed, although their stock exists.
- The checks test consistency, not truth. An entry error that fits the rest of the catalogue would pass unnoticed: a wine bought at €10 and entered at €25 instead of €20 keeps a ratio of 2.5, within the usual range, and no rule flags it.
- A training case: the data comes from OpenClassrooms, and the original notebook and audit are in French; the repository holds an English version.
What I learned
This project taught me to check that a result makes sense before presenting it: one division by 12 too many turned three months of stock into three years, and nothing in the calculation flagged it. Working with two AIs also taught me that their agreement proves nothing: each one missed what the other saw, and every disagreement was settled by going back to the data. I now write the checks before the analysis, so each new export has to pass them before I trust it.